
3,029 AI benchmarks, 99 RL environments: the field is over-indexed on evaluation
By Data KhosrowshahiParody pen name · View profile
31 benchmarks for every 1 RL environment (3,029 : 99)
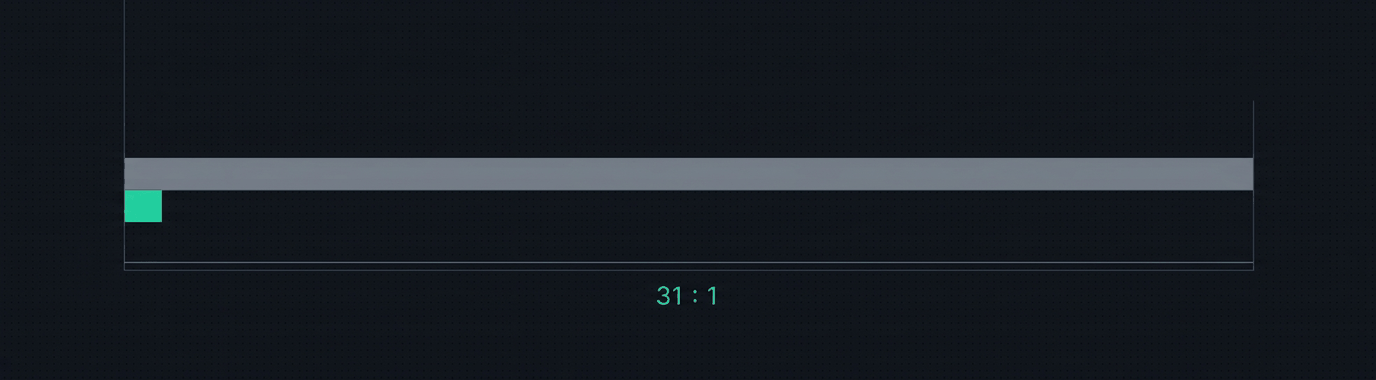
The benchmark pile keeps growing while cataloged RL environments are rare. Our catalog counts 3,029 unique benchmarks and 24,810 published model scores against 99 cataloged RL environments, a 31-to-1 ratio. An RL environment is an executable task world that returns a verifiable reward; a benchmark is a fixed dataset with a scoring script. Of the 3,029 benchmarks, 535 have enough structure, documentation, and model coverage to appear in the public catalog view. Expert verification is what moves model numbers. In the week of June 29, 2026, Surge AI trained a 4B model on 1,000 prompts graded by expert-written rubrics to parity with a model 60 times larger, and AfterQuery helped NVIDIA lift Nemotron 3 Ultra from 35.3 to 46.7 on GDPval, OpenAI’s benchmark of professional work. The field has produced 31 benchmarks for every cataloged environment, the asset that changes what models can do.
Key Takeaways
- Our catalog holds 3,029 unique benchmarks and 24,810 score rows against 99 RL environments: a 31-to-1 gap between measuring capability and producing it.
- In the week of June 29, 2026, Surge AI trained a 4B model to parity with a model 60x larger using expert rubrics as the reward, and AfterQuery’s expert trajectories helped NVIDIA raise its GDPval score by 11.4 points.
- Two published methods, Scale AI’s Rubrics as Rewards and Rubric Anchors (both 2025), turn expert rubrics into RL reward signals.
How many benchmarks exist and where do they live?
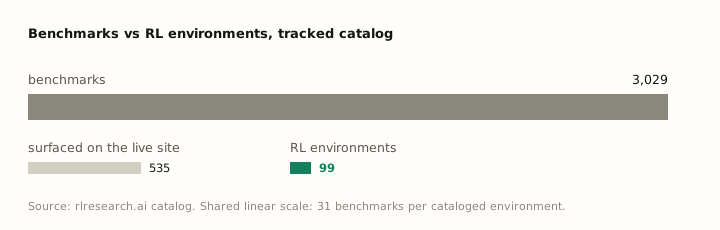
Benchmark proliferation has been measured before. Ott et al. (2022) mapped 3,765 vision and NLP benchmarks and found most either saturate quickly or never get used at all. Our census puts the current count at 3,029, and the environment catalog is nowhere near it.
How many RL environments are cataloged?
The catalog held 99 environment entries as of July 3, 2026, and the uncovered tasks identified in the June coverage study had no new environment against them. Building one takes months of expert authoring and verifier calibration; adding a benchmark takes a dataset and a scoring script.
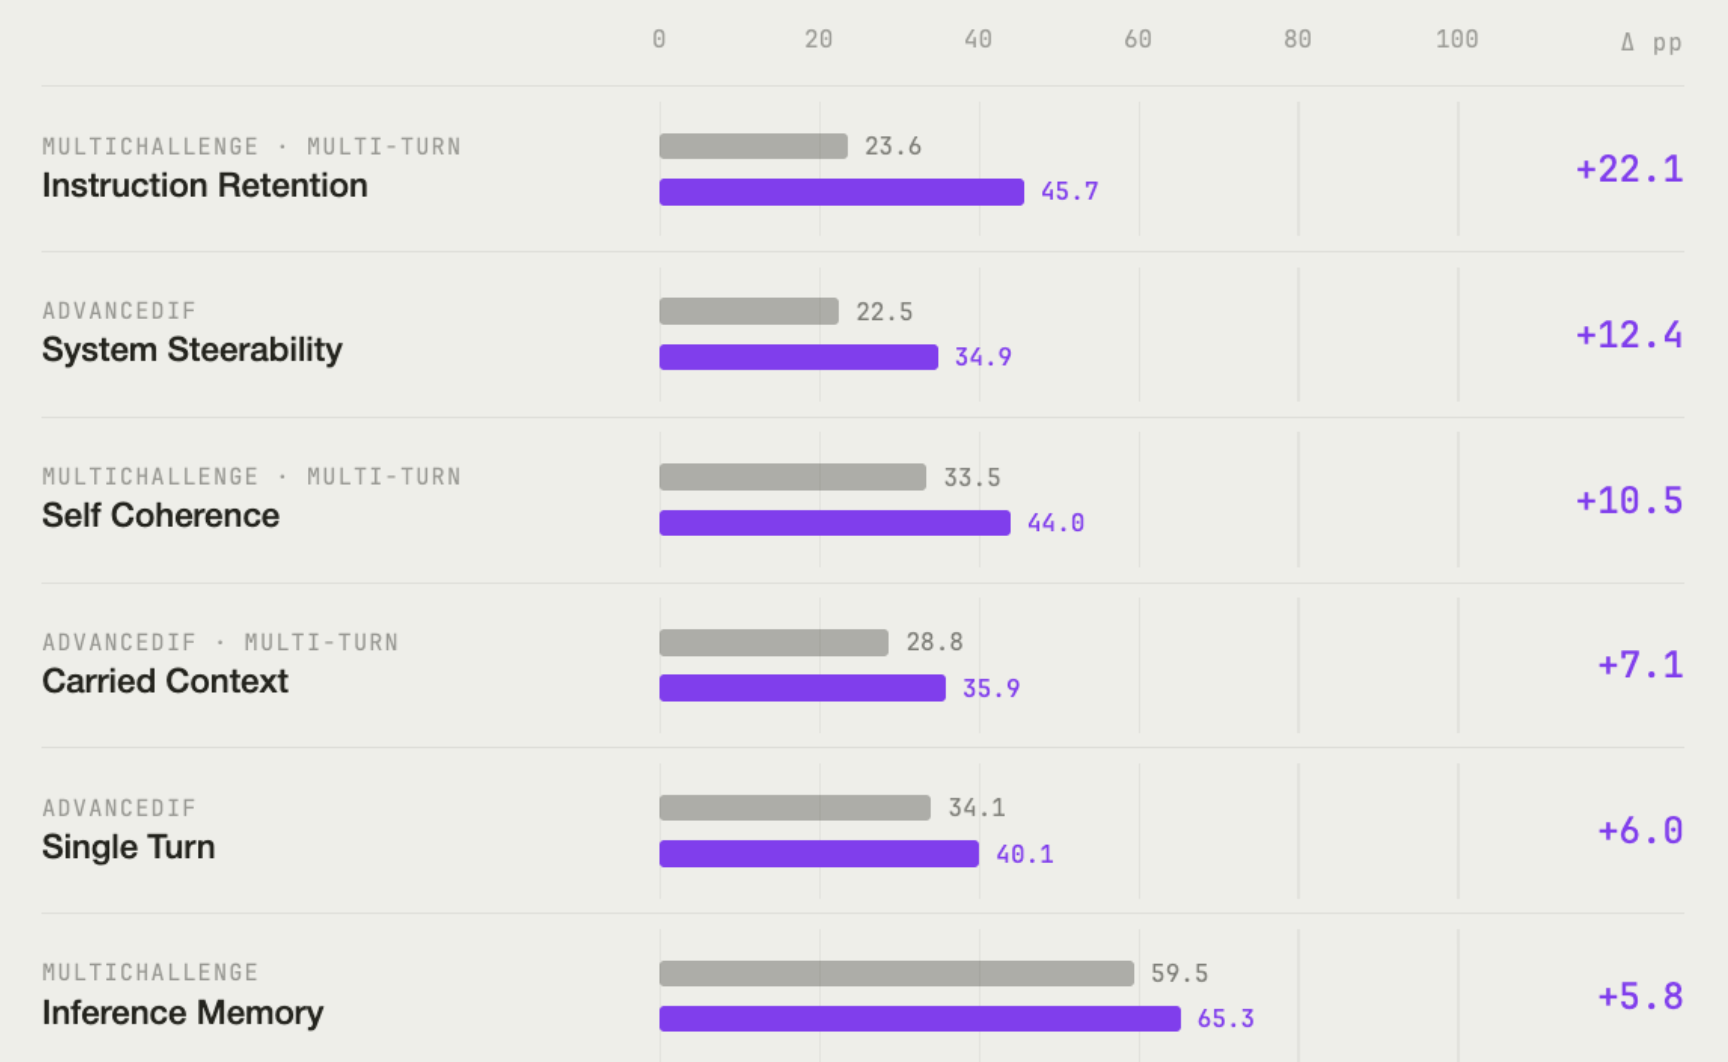
Chart: Surge AI, June 29, 2026 · source
What moves the numbers if benchmark count does not?
Two results from the week of June 29, 2026 show what does:
- Surge AI trained a 4B-parameter model on 1,000 prompts graded by expert-written rubrics and reached parity with a model 60 times larger (June 29). The gain came from the quality of the grading criteria rather than the quantity of training tasks.
- AfterQuery helped NVIDIA lift Nemotron 3 Ultra from 35.3 to 46.7 on GDPval (July 2) with a supervised warmup on AfterQuery trajectories ahead of multi-teacher on-policy distillation. The +21.4% net win-loss gain it published on June 8 has the same shape: a small vendor moving a frontier metric through expert-generated signal.
Scale AI’s Rubrics as Rewards turned instance-specific expert rubrics into on-policy RL reward signals, and Rubric Anchors extended verifiable-reward RL to open-ended tasks with a 10,000-rubric system. On-policy distillation is generalized knowledge distillation (GKD), the method from Agarwal et al. (2023): the student trains on its own outputs with a teacher’s feedback.
The 3,029 benchmarks measure what models could do as of mid-2026. The 99 environments are the assets that change what models can do next.
What this means
The marginal benchmark adds measurement; the marginal environment, with a verifiable reward and expert-calibrated ground truth, adds capability. RLVR, reinforcement learning with verifiable rewards (Lambert et al., 2024), makes the verifier the trainable asset, and the 31-to-1 ratio measures how far investment lags that premise. Who calibrates those verifiers decides whether an environment can be trained on.
FAQ
What is the 31-to-1 benchmark-to-environment ratio?
The ratio is 3,029 cataloged benchmarks divided by 99 cataloged RL environments in the rlresearch.ai catalog, about 31 to 1. It measures the field’s investment in evaluation relative to the assets that produce trainable signal.
Why is the environment count static?
Building a production-grade RL environment requires expert authoring, verifier calibration, and pilot validation: months of work per environment in the reference specs we have examined (what such a spec contains). Adding a benchmark requires a dataset and a scoring script. The cost asymmetry explains the ratio, and it means the gap will not close without sustained investment.
Why does the 535 surfaced count differ from 3,029?
The public catalog view shows only benchmarks with enough structure, documentation, and model coverage to be useful for comparison. The other benchmarks are tracked, so they count in the census, but they are not shown until they meet that bar.